5. Dashboard#
To start, ensure you install the dashboard dependencies by running:
pip install siliconcompiler[dashboard]
At this point, you should have the dashboard in your environment.
Then, run the command:
sc-dashboard -cfg <path to manifest>
You can specify the port by adding a port flag. If you don’t provide one, the port will default an auto selected one or to 8501:
sc-dashboard -cfg <path to manifest> -port <port number>
And/or you can include extra projects by adding one or multiple -graph_cfg flags.
The name of the manifest is optional.
If you don’t provide one, the name will default to the path to manifest:
sc-dashboard -cfg <path to manifest> -graph_cfg <manifest name> <path to manifest> -graph_cfg <manifest name> <path to manifest>
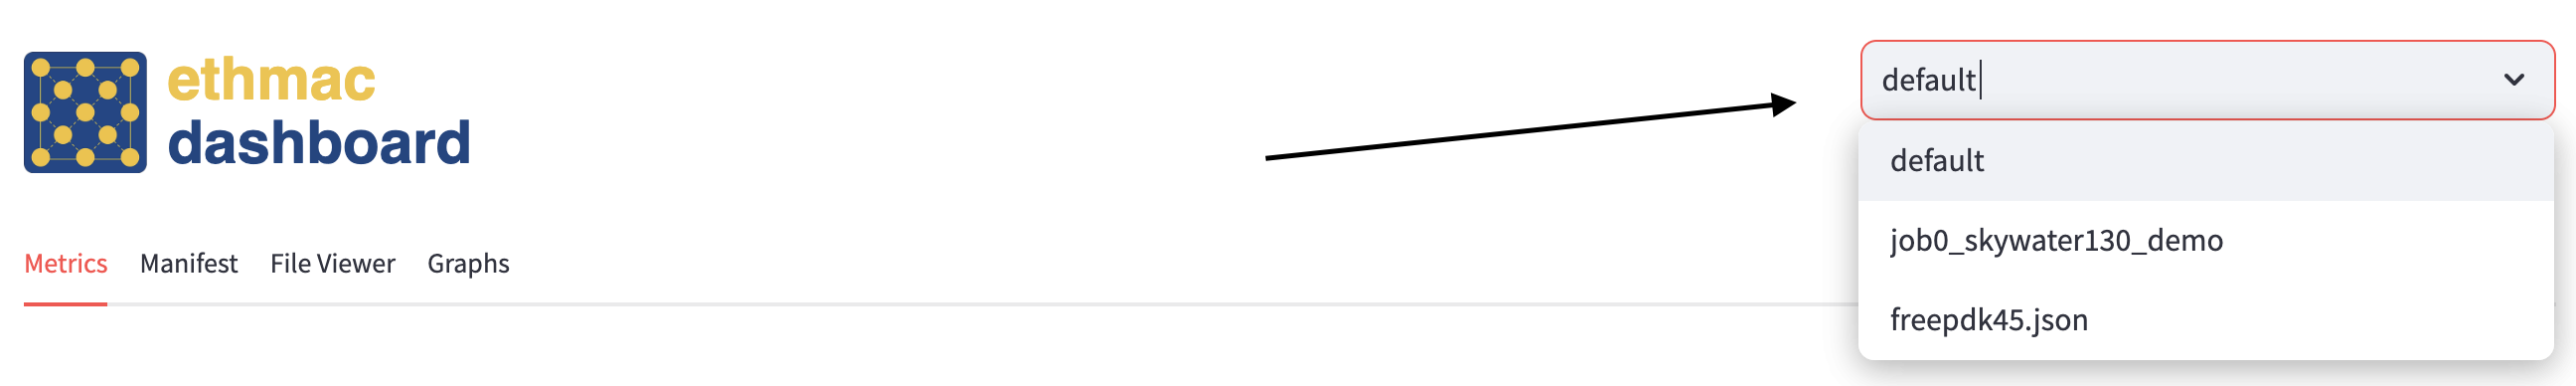
5.1. Header#
In the header, you can select any of the projects that are part of the history of the project loaded in and any of the other projects loaded in through the -graph_cfg flag (see arrow below).
5.2. Metrics Tab#
You will load into the metrics tab similar to the one below upon running sc-dashboard.
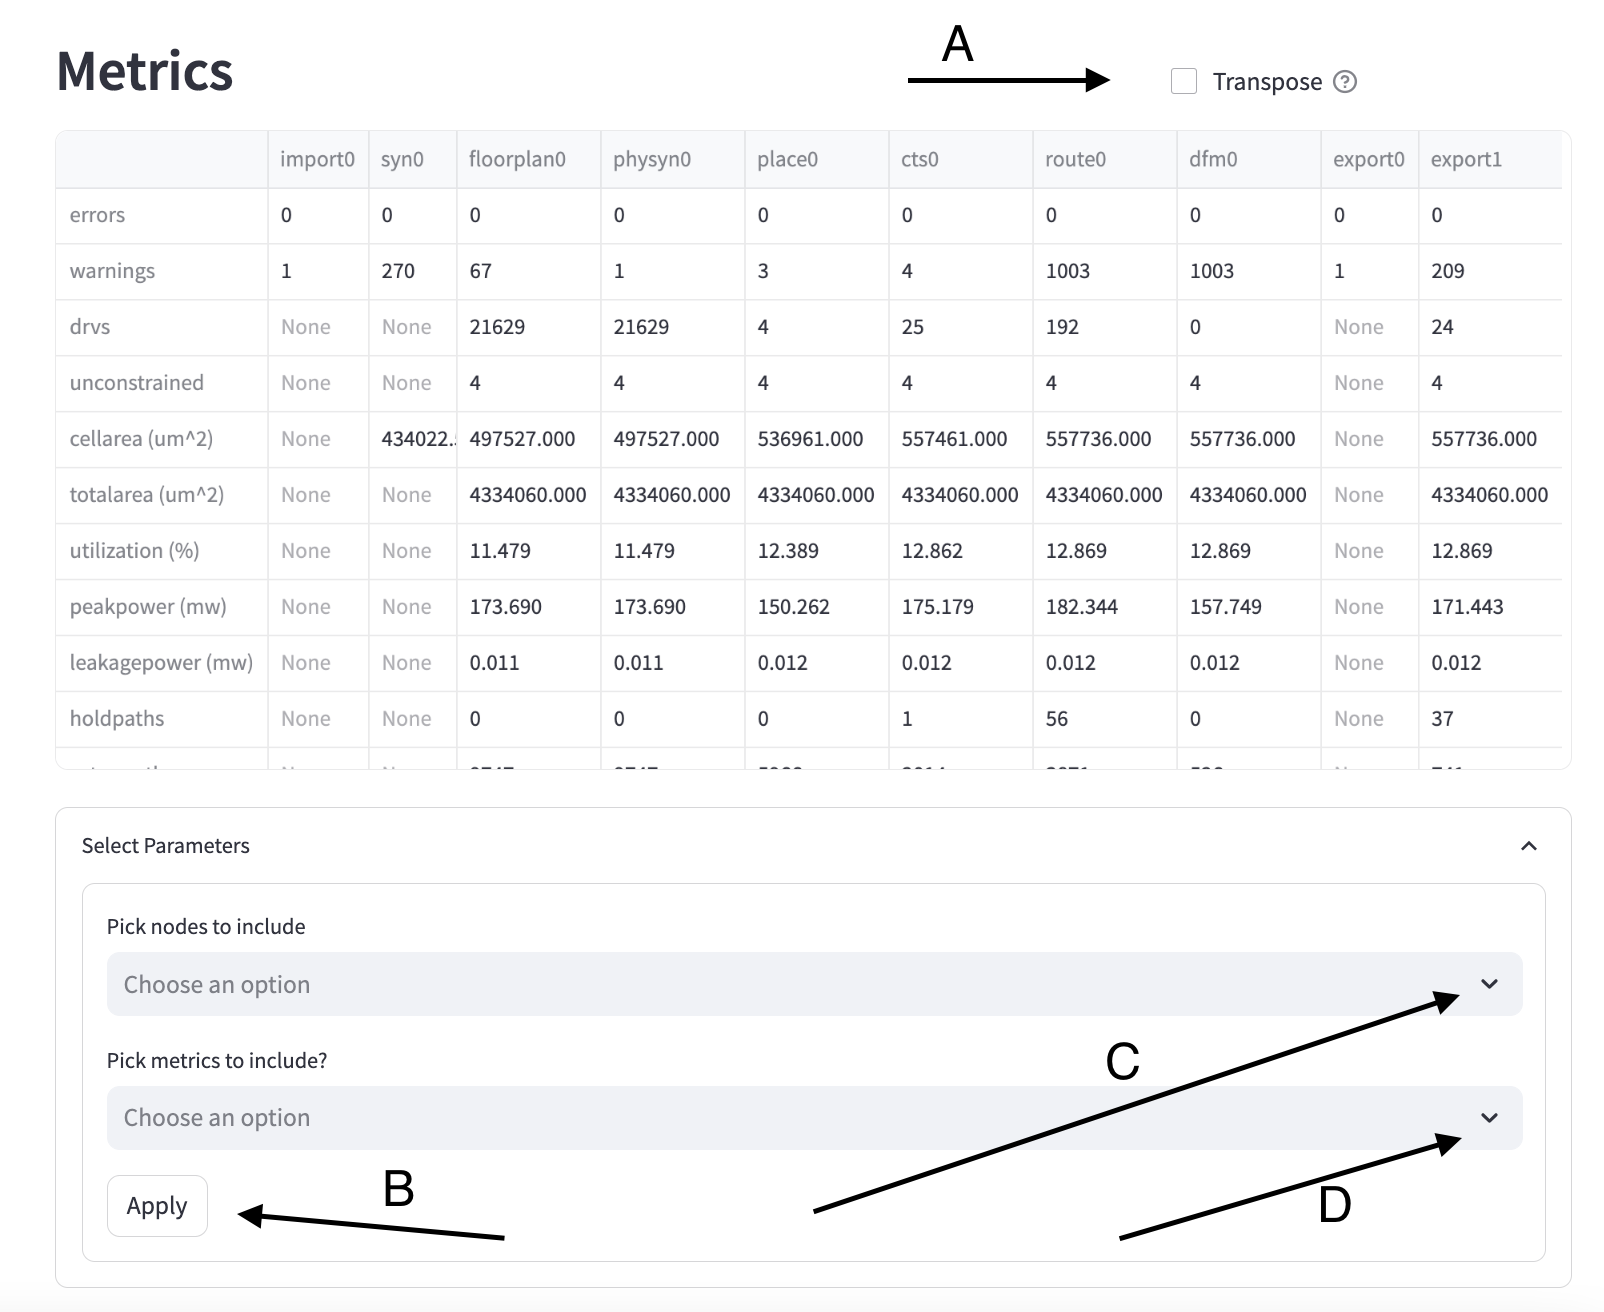
5.2.1. Metrics Section#
The metrics section displays an overview of each value for each metric tracked for each node. Click “Transpose” to switch the axes (arrow A in image below).
You may use the “Select Parameter” expander to specify certain nodes and/or metrics (arrow C and D in image below). Click “Apply” to make those changes (arrow B in image below). If you don’t specify any nodes and/or metrics, all of the nodes and/or metrics will be shown.
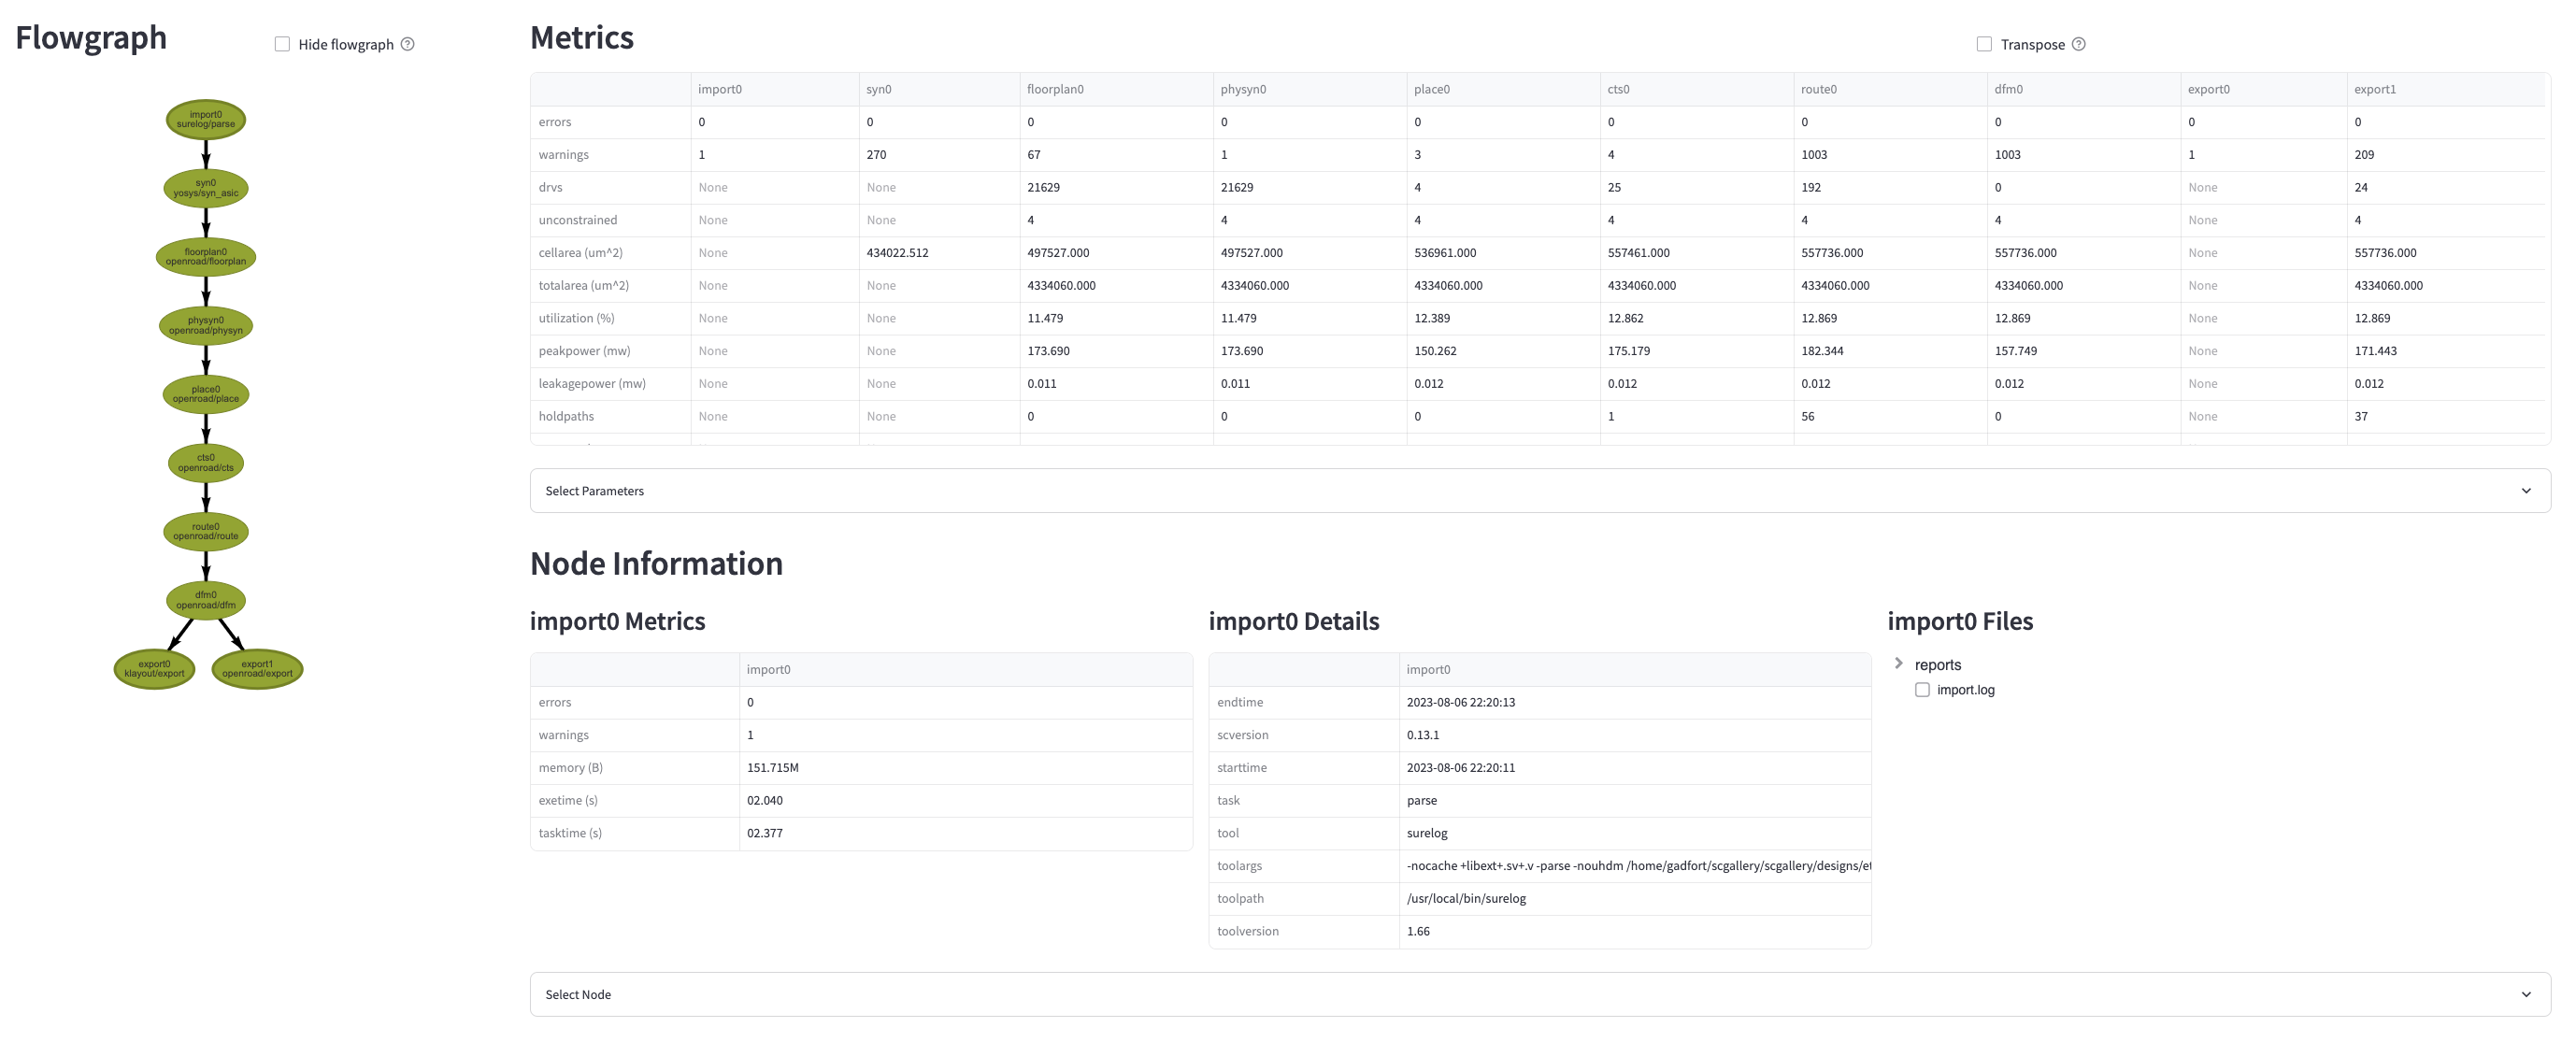
5.2.2. Flowgraph Section#
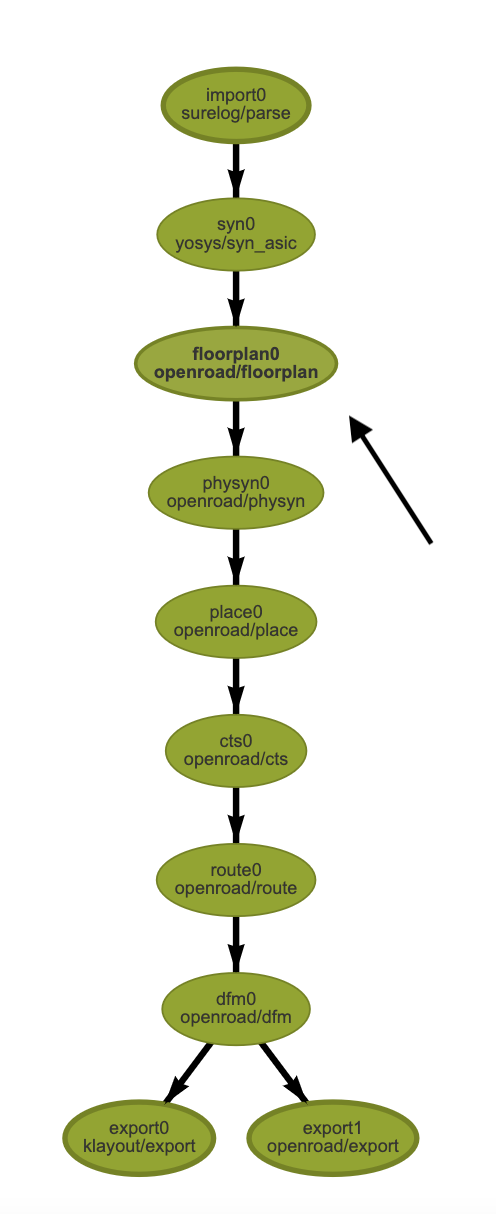
The flowgraph section displays the data dependencies for each node. Nodes are color-coded based on their task status. Green means task status is a success, red means task status is a failure, and yellow means task status is pending. Currently, task status should never be yellow because you cannot view the dashboard while the build is not done. This is functionality we hope to add. Paths that are part of the ‘winning path’ will have bolded edges.
To activate the flowgraph, click on it once. This allows you to interact with the flowgraph. You can drag nodes around, pan the view, and zoom in/out. You can also click nodes to select them for the Node Information Section. You can see a node is selected by it becoming bolded (in the image below, that’s floorplan0). Double clicking nodes will send you to a blank html page. We are aware of this bug.
5.2.3. Node Information Section#
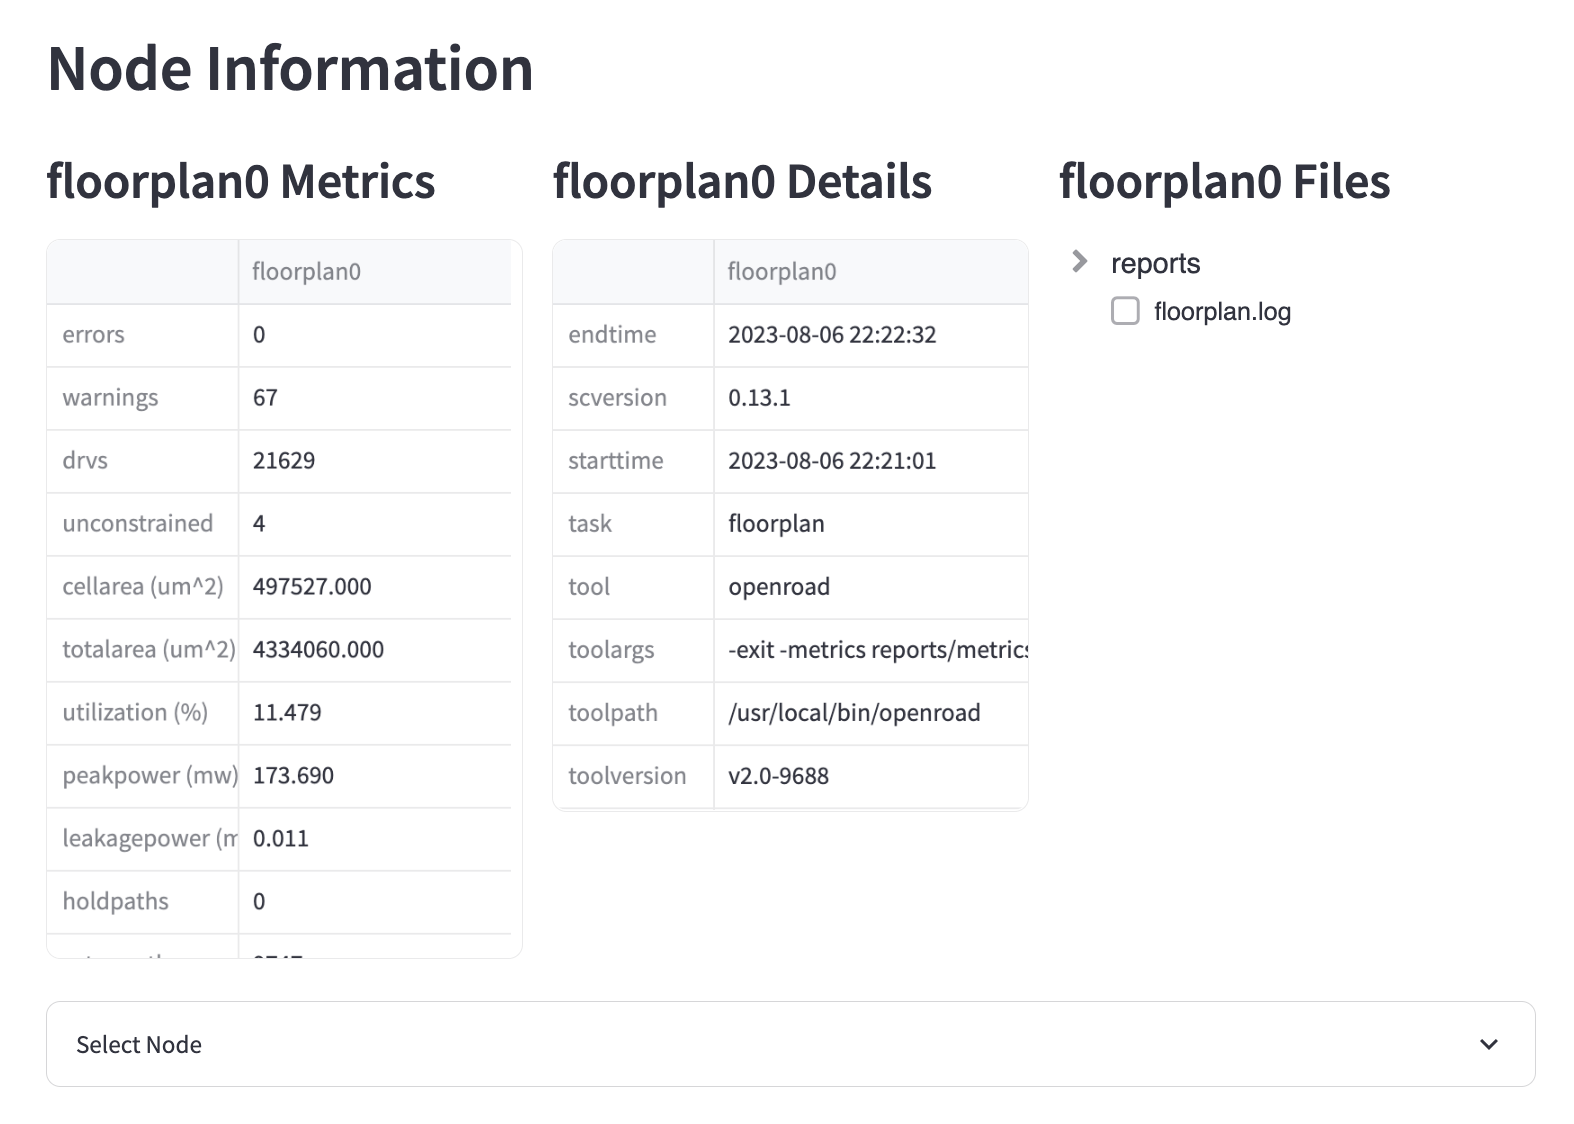
Below is the node information section. It consists of three subsections - node metrics, node details, and node files.
You can select a node using the “Select Node” expander as seen with arrow’s A and B below. Click “Apply” to make the change.
5.2.3.1. Node Metrics Subsection#
The node metrics subsection consists of all of not None values recorded for each of the metrics recorded for the selected node.
5.2.3.2. Node Details Subsection#
The node details subsection consists of all of the characteristics about this node that are not reflected in the metrics section.
5.2.3.3. Node Files Subsection#
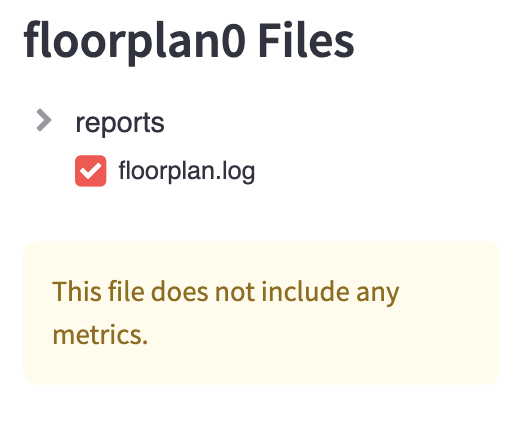
The node files subsection consists of all of the files for a given node that are in the build directory.
Selecting a node will display a list of the metrics that the file informs below the file tree. In the picture below, no metrics can be found in the floorplan.log file.
5.3. File Viewer Tab#
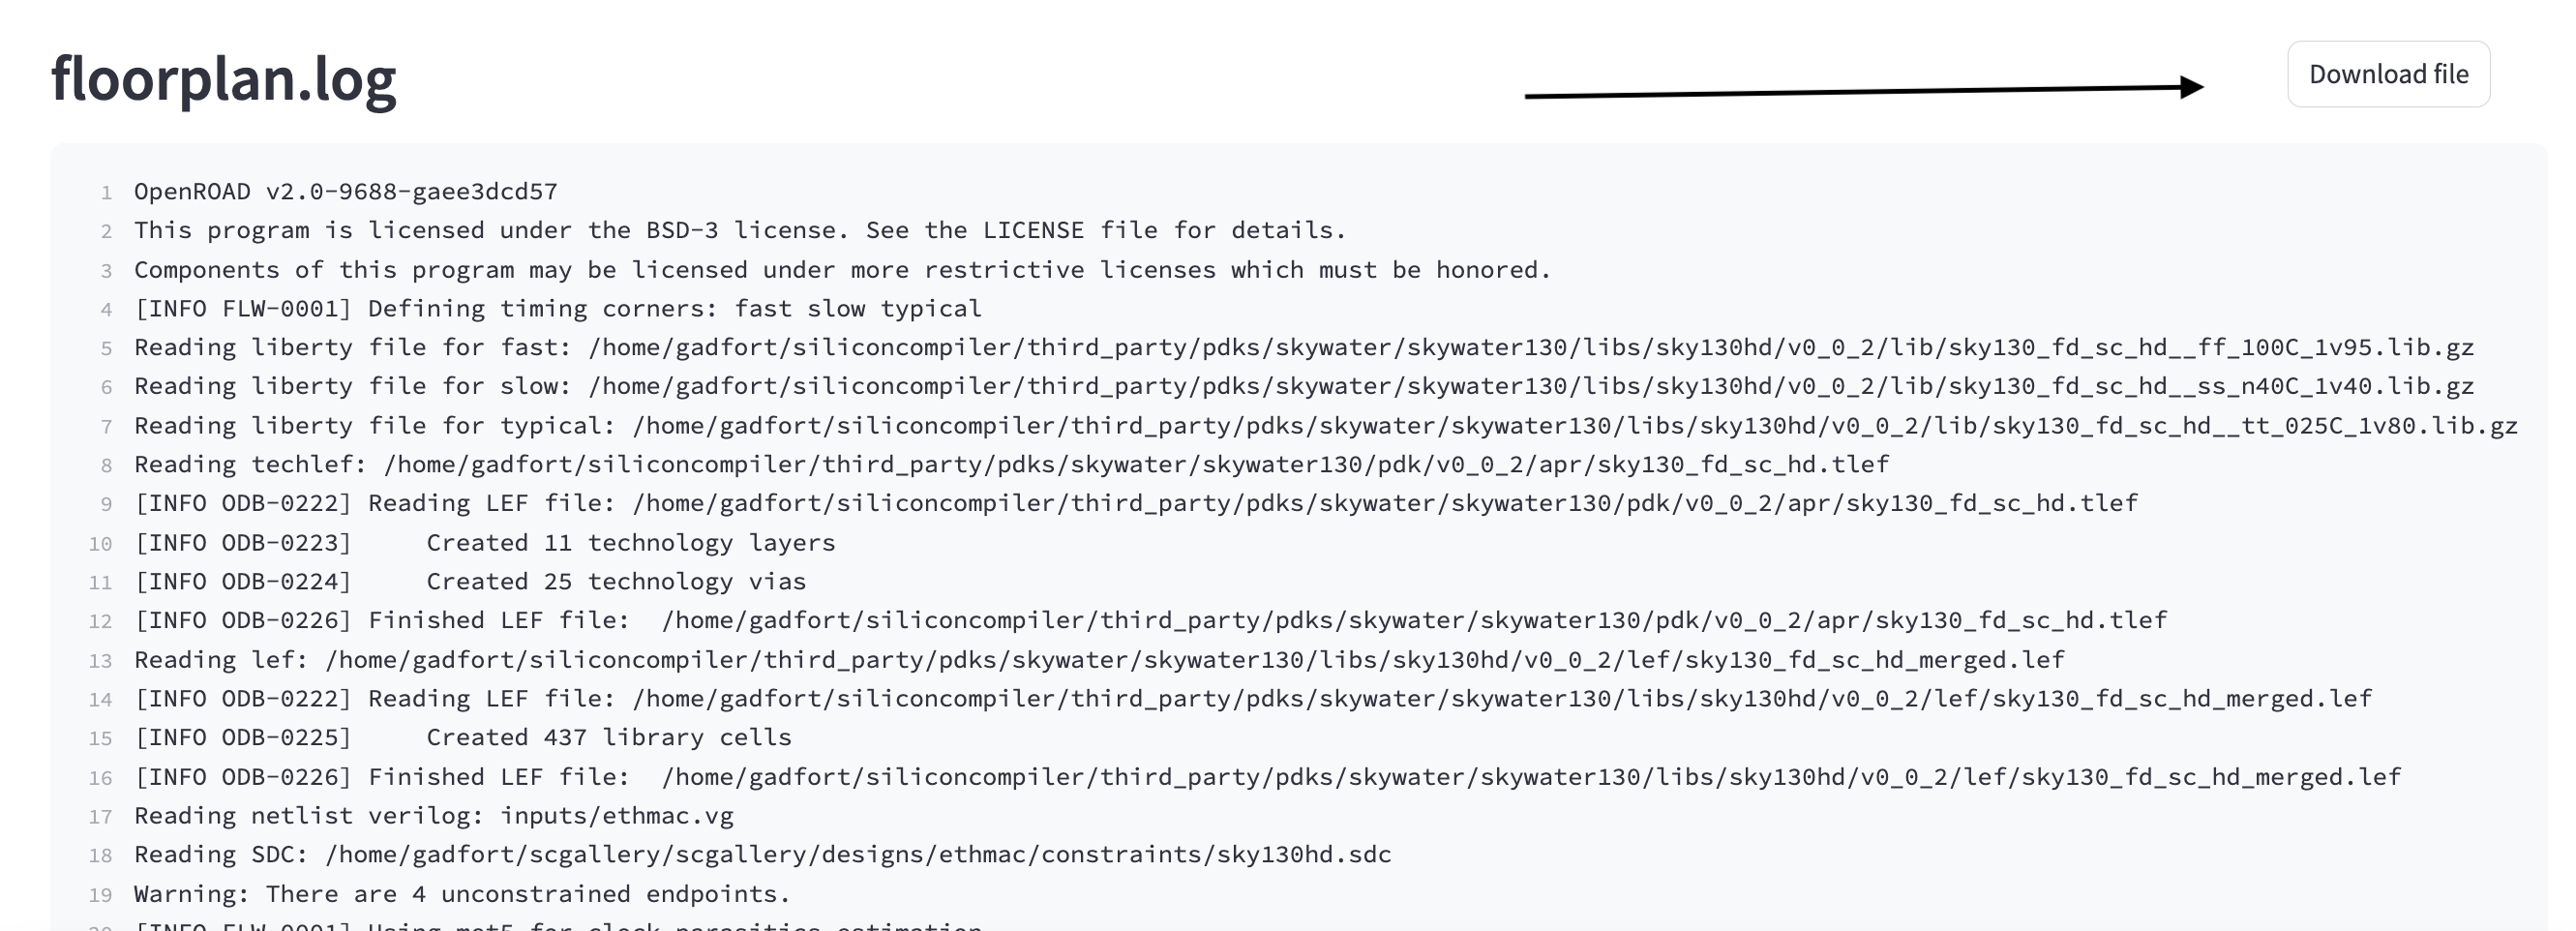
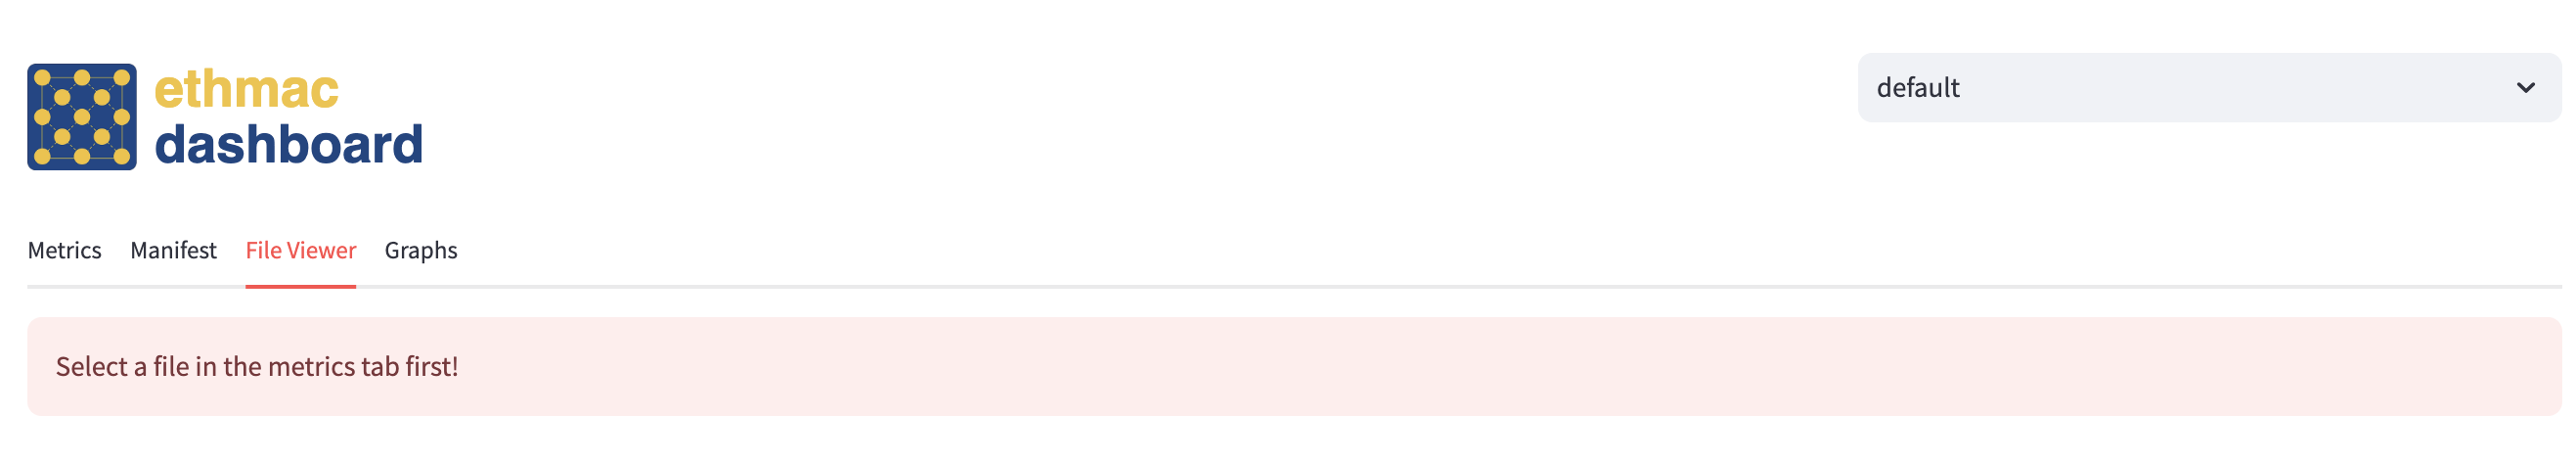
The selected node you clicked in the Node Information Section will appear here. The header is the name of the file selected. You can download the file by clicking the download button (as by the arrow in the image below).
If no file is selected, the error message below will be displayed telling you to select a file first.
5.4. Manifest Tab#
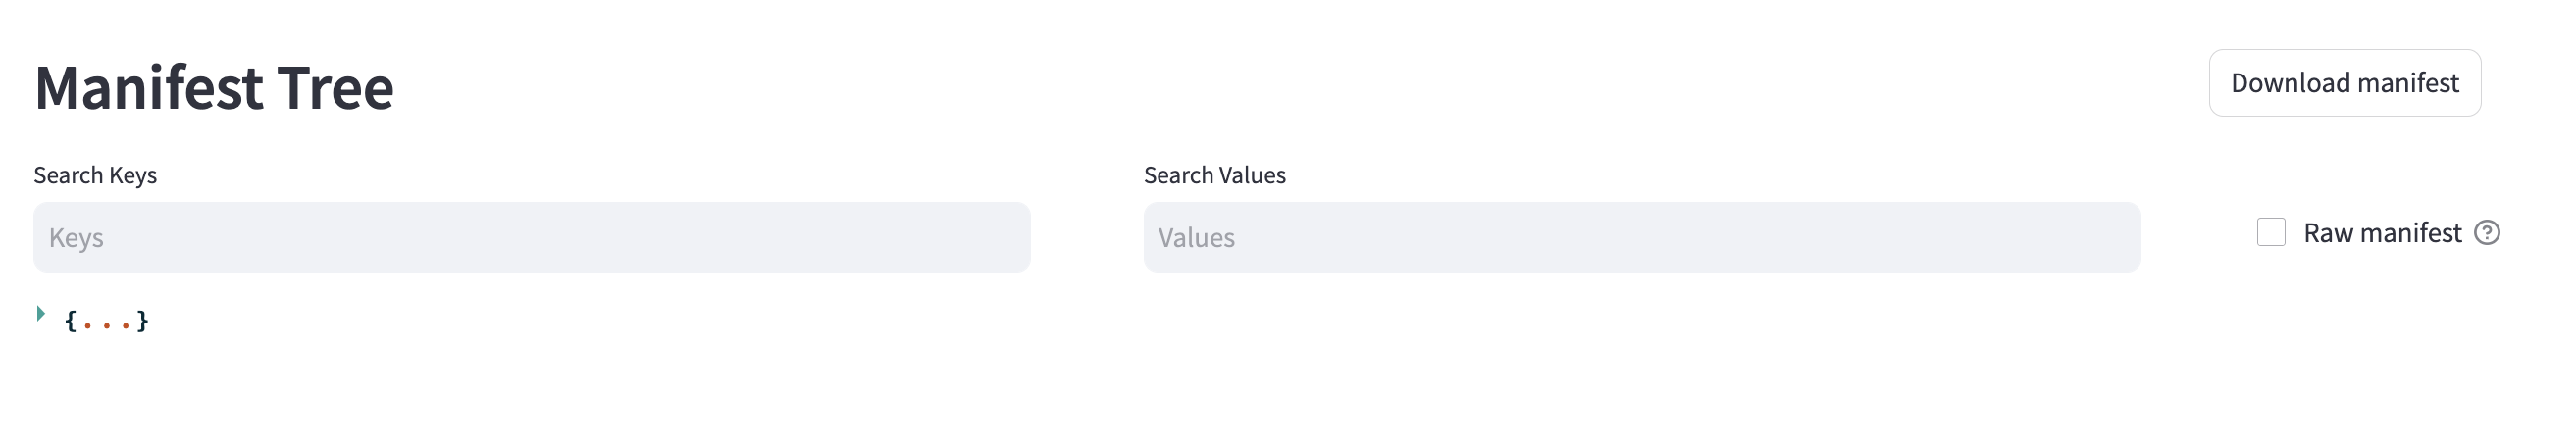
The next tab you can select is the manifest tab. This displays the manifest after it has been filtered through to make it more readable. More specifically, if the pernode value of the leaf of the Schema is pernode is “never”, the value of the leaf is the value of the leaf[‘node’][‘*’][‘*’][‘value’]. If there is no value for that, then it is the value of the leaf[‘node’][‘default’][‘default’][‘value’]. Outside of that, the nodes will be concatenated, or if the step and index is default and default or “*” and “*”, the node will be default or “global”, respectively.
To view the manifest, click the arrow on the dictionary (arrow A). The search bars will return partial matches for either the keys (arrow B in image below) or the values (arrow C in image below). Press enter to search. If you do not want to search, delete any text in the search bars and press enter. You may download the JSON as you view it at any point (arrow D in image below). The name of the file generated is “manifest.json”. You can view the raw manifest by clicking the checkbox to the right of the search bar (arrow E in image below).
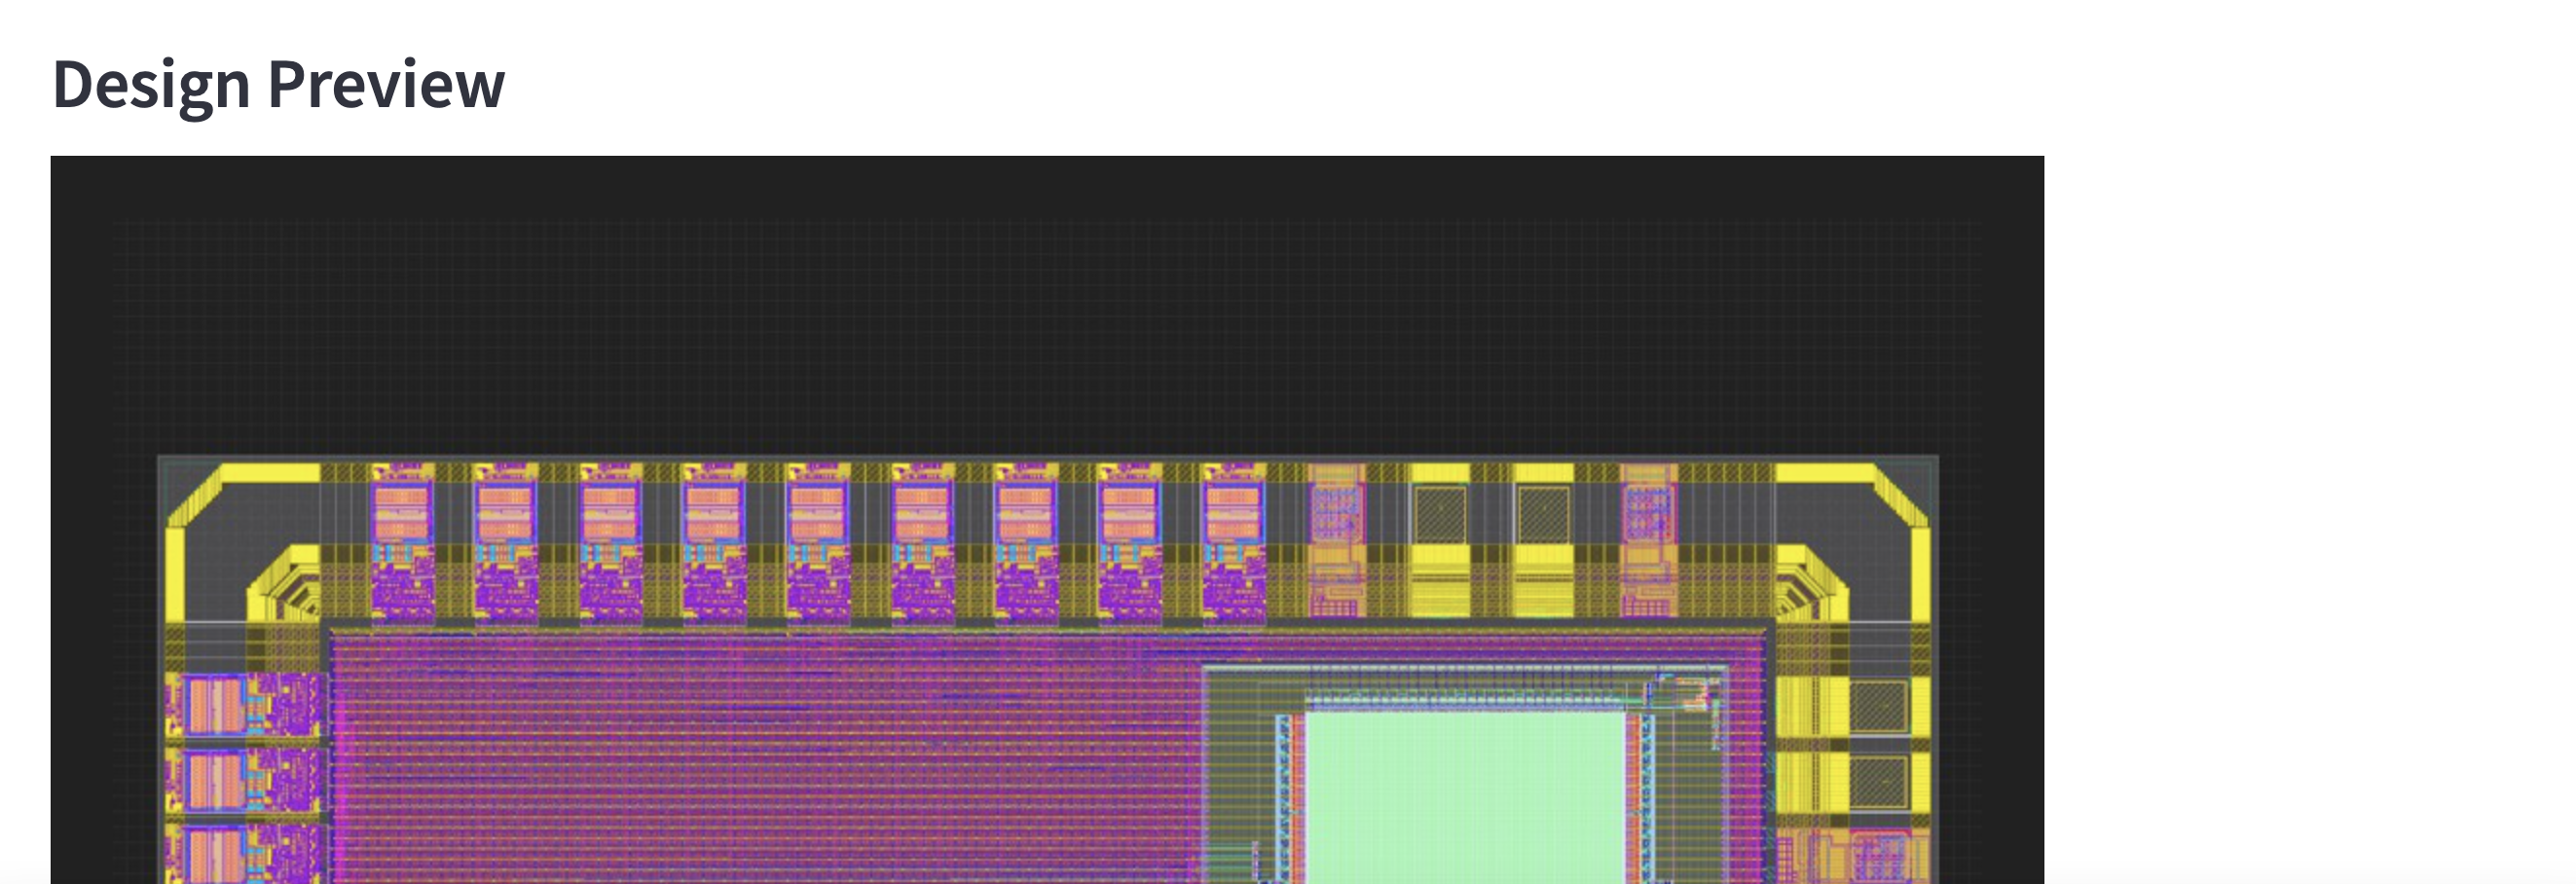
5.5. Display Preview Tab#
This displays the preview image of the project if there is one in the directory (example given below). If not, this tab will not be included.
5.6. Graphs Tab#
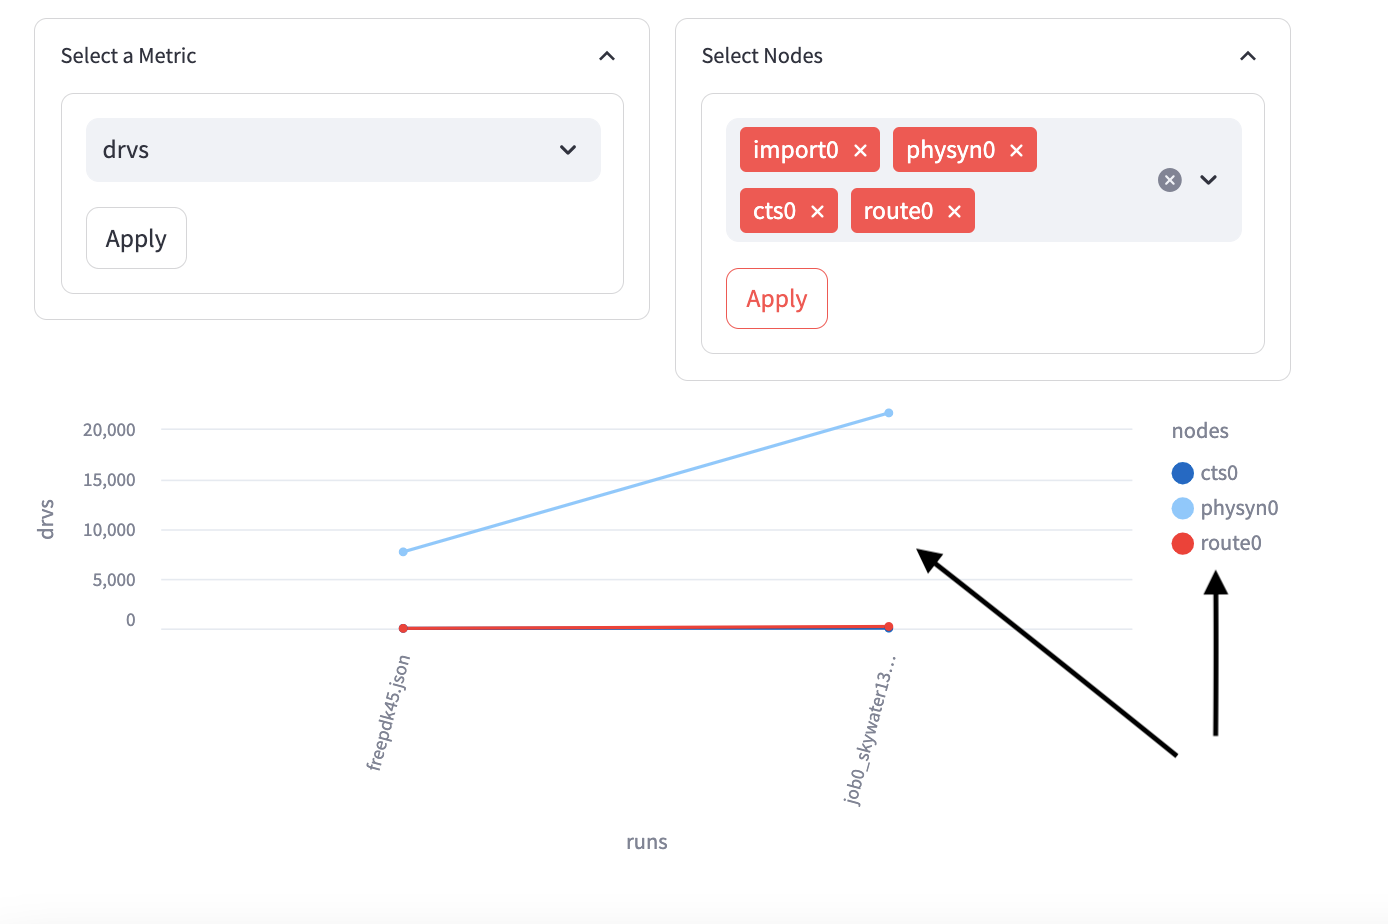
This tab is meant to make comparisons between nodes for a given metric across many projects.
At the top of the panel, select which runs/jobs to include for all the graphs (arrow A in image below). These are the runs
from the project’s history and the runs included with the -graph_cfg flag.
Move the slider to add more graphs or remove old ones (arrow B in image below). Removing old graphs will remove them in the reverse order in which they were added.
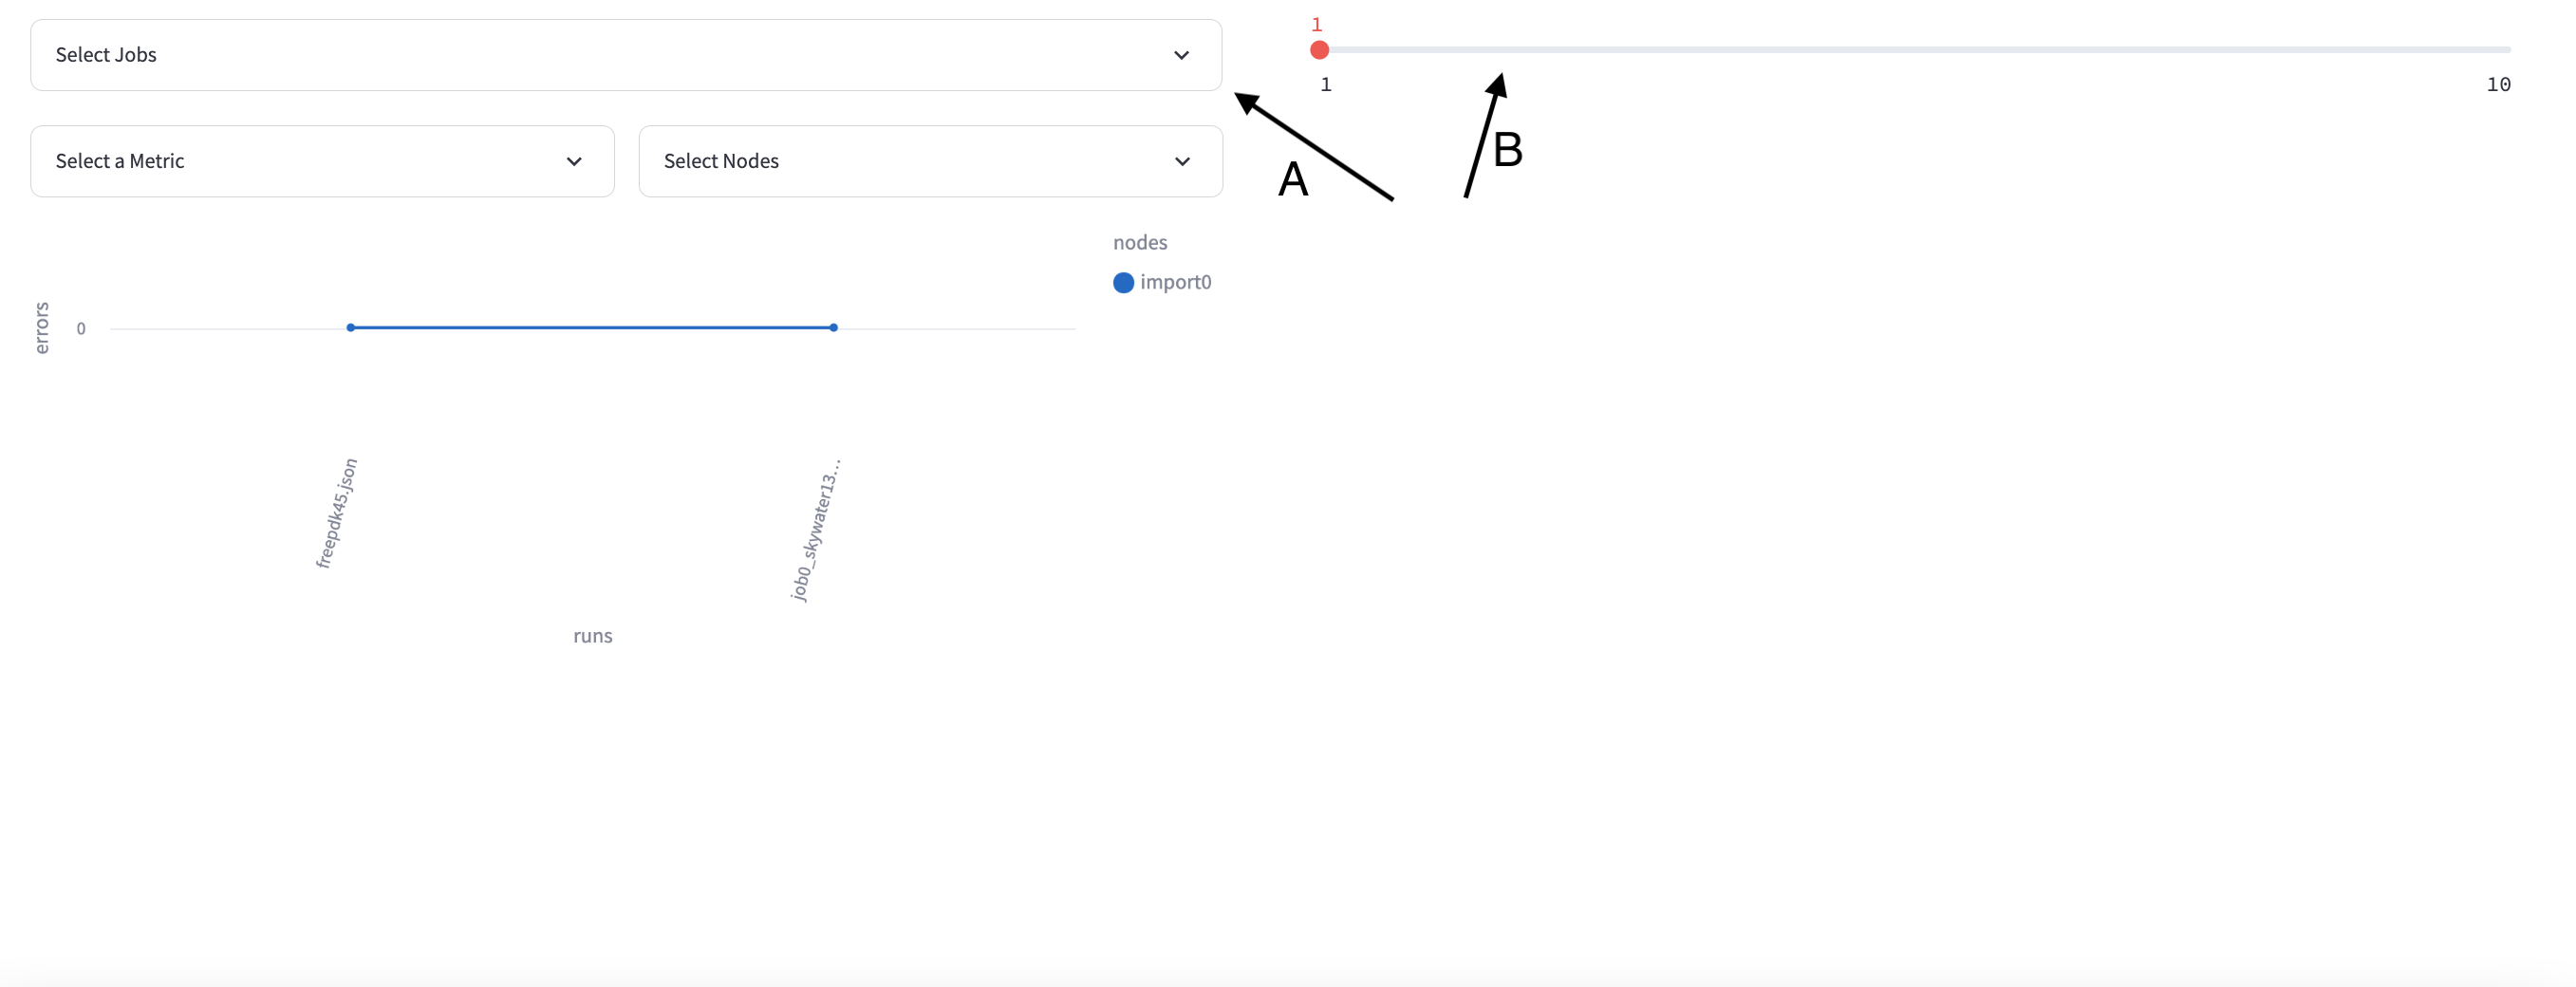
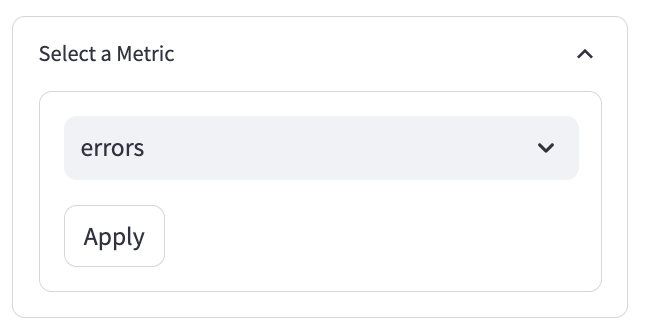
For each graph, you must select one metric (show in image below). A random metric will be preselected. Click ‘Apply’ to see the changes.
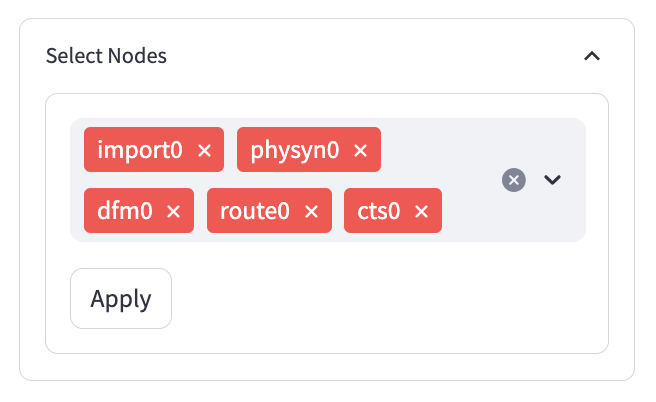
You may select any amount of nodes (show in image below). A random node will be preselected. If you select 0 nodes, a blank graph will appear. Click ‘Apply’ to see the changes.
Sometimes nodes may not have values for a metric, in which case they will not be included in the graph. In the image below, import0 is not in the legend.
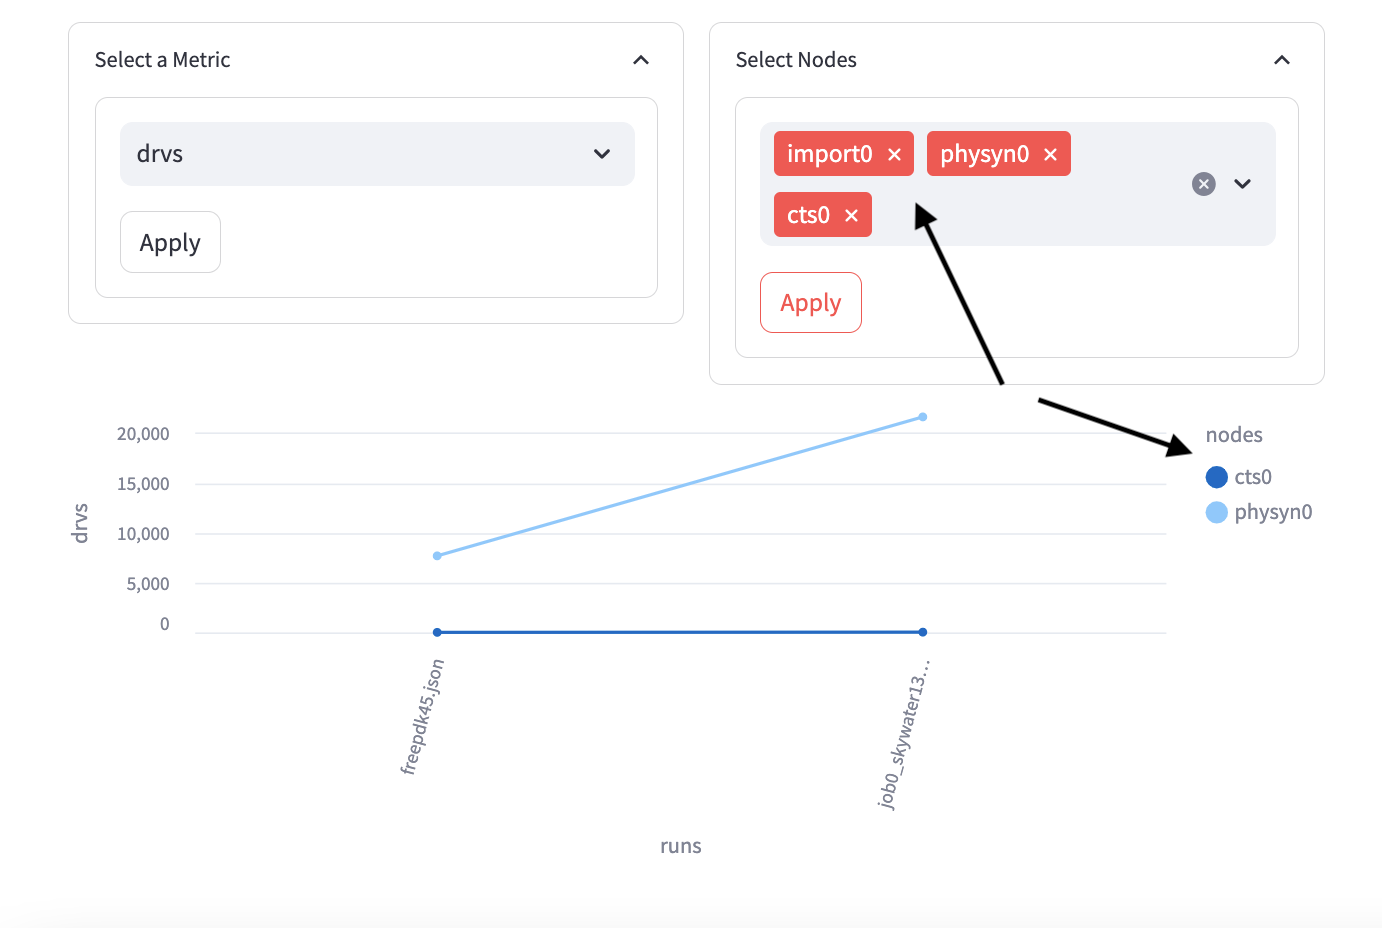
Sometimes nodes that are in the legend are not visible on the graph. What has happened is that they have the exact same values as some other node. Consider deselecting other nodes in this case. In the image below, cts0 is barely visible on the graph.